Directory Insight SIEM Integrations
- Mark as New
- Bookmark
- Subscribe
- Mute
- Subscribe to RSS Feed
- Permalink
- Report Inappropriate Content
03-07-2023 04:13 AM - edited 02-13-2024 07:07 PM
Hey Folks,
As many of you might be wondering (or already asked 🙂) about integrating SIEM solutions with JumpCloud logs - Directory Insights to be more specific, in order to centralise security event monitoring and management, @JuergenKlaassen had a write-up that showed us a few possible options. I had the opportunity to spend some time diving deeper into this topic, and today, I would like to share the steps I took from setup to usage - as a SIEM “user”.
Here is the list I worked with:
- Sumo Logic - via AWS serverless app
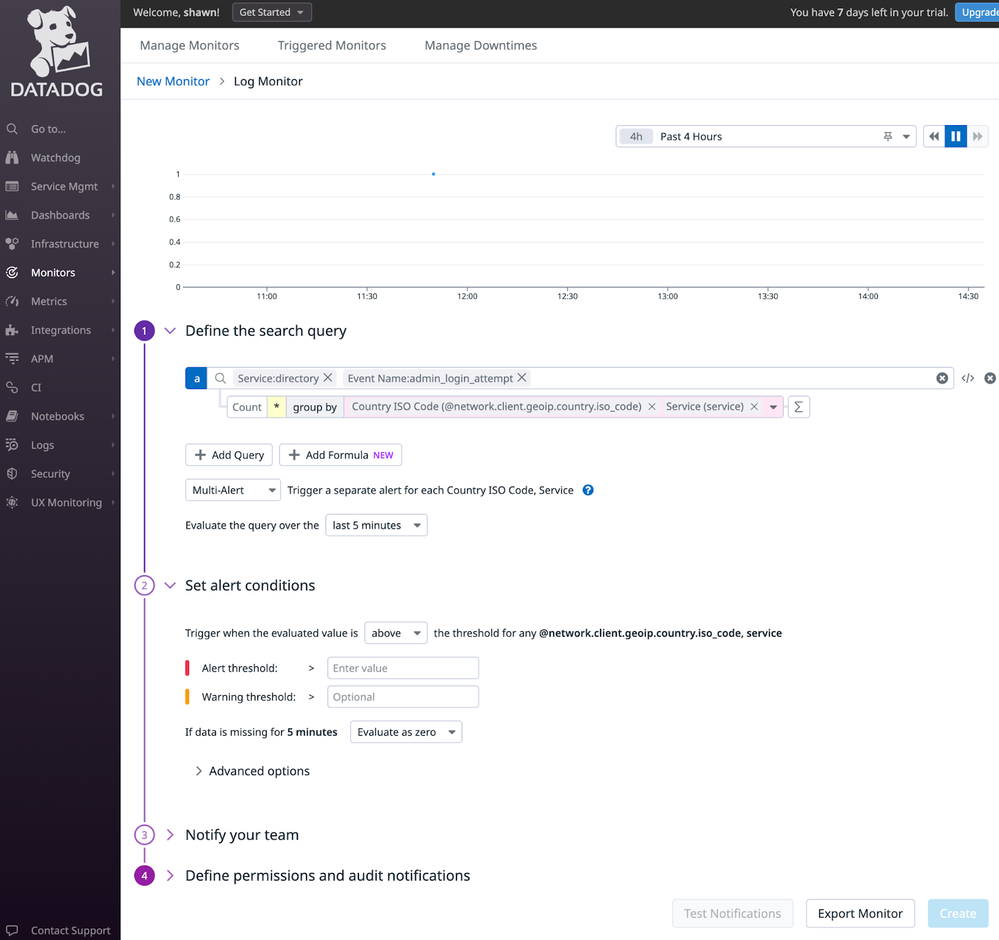
- DataDog - via native integration
- Splunk - Didn’t work out unfortunately
I used our AWS serverless app to extract the DI data to an S3 bucket as the starting point - except for DataDog, thanks to the native integration we have.
Let’s dive into it.
(Here is an introduction about DI in case you are not familiar with it)
Sumo Logic
Setup
- Once finished deploying the AWS serverless app, locate the S3 bucket created during the process.
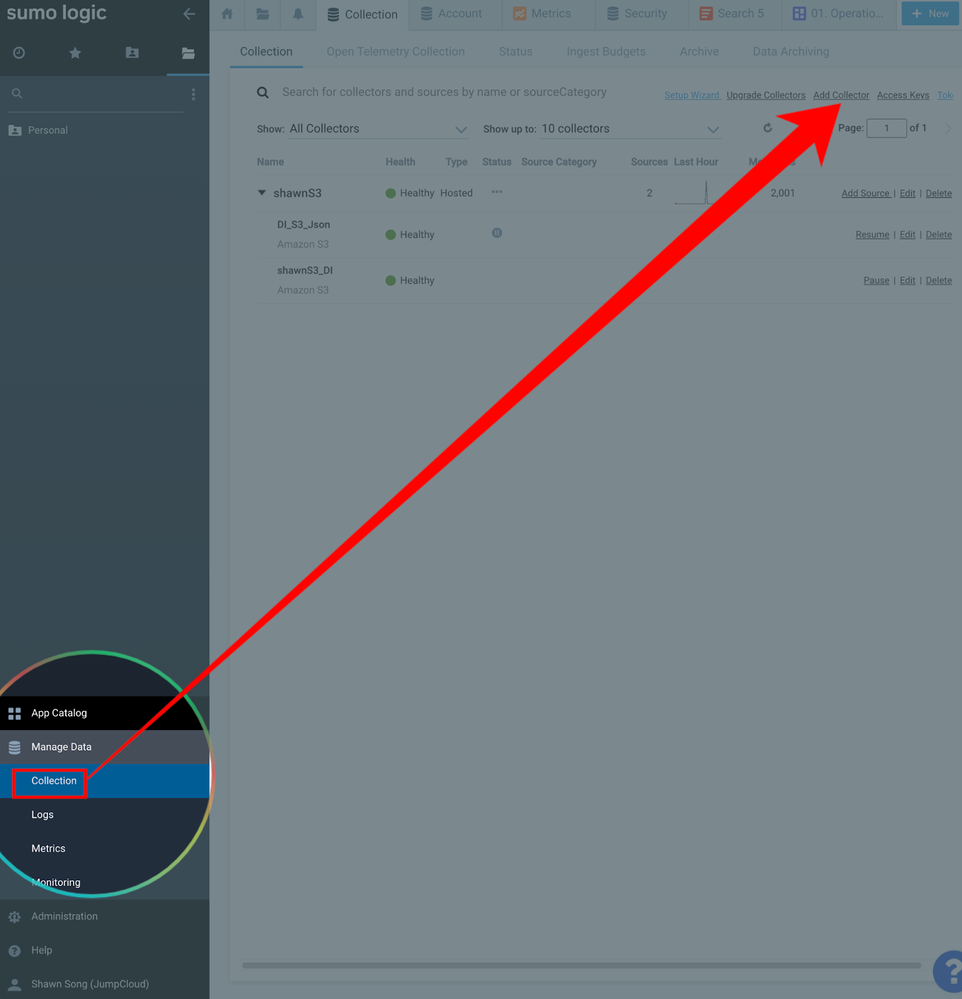
- Go to “manage data” -> “collection” -> “add collector”:
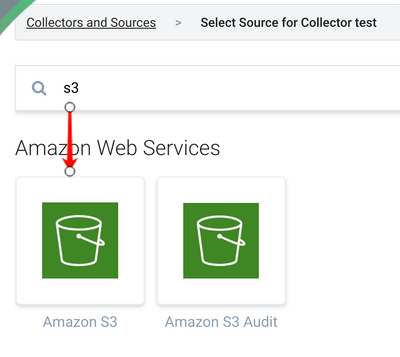
- Select “Hosted Collector” -> name it, and save -> search and select “Amazon S3” as the source.
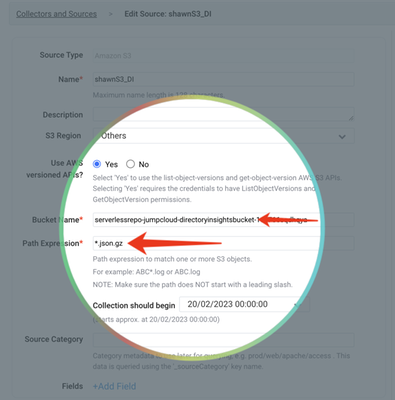
- Name the source, and input the bucket name, path expression
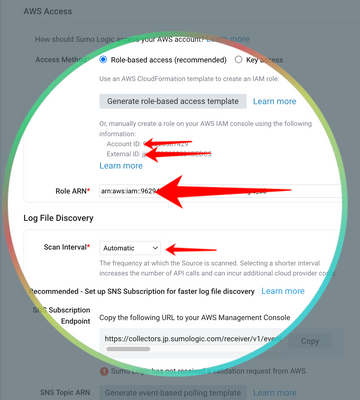
- Setup AWS access for Sumo Logic as per this guide.
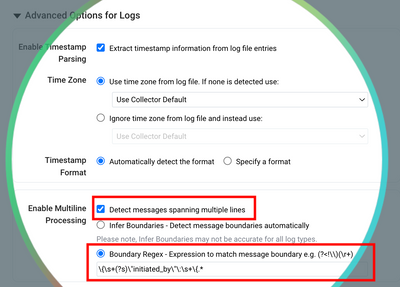
- Now here is the most important part 😄(where I spent most of my time figuring this out with Sumo Logic’s support engineer) - use a Regex pattern below to define the JSON formatted DI event:
\{\s+(?s)\"initiated_by\"\:\s+\{.*
Use Cases
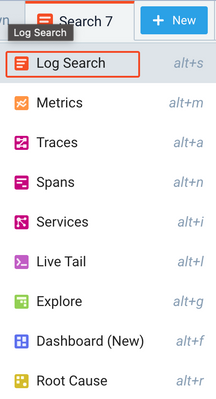
- Now you can jump straight to log search:
- Then use the query example like below to have an overview about the whole directory:
| json field=_raw "[0].event_type" as _0__event_type | count by _0__event_type - If we glide into the query language a bit more, you can enriching the view with country / city info:
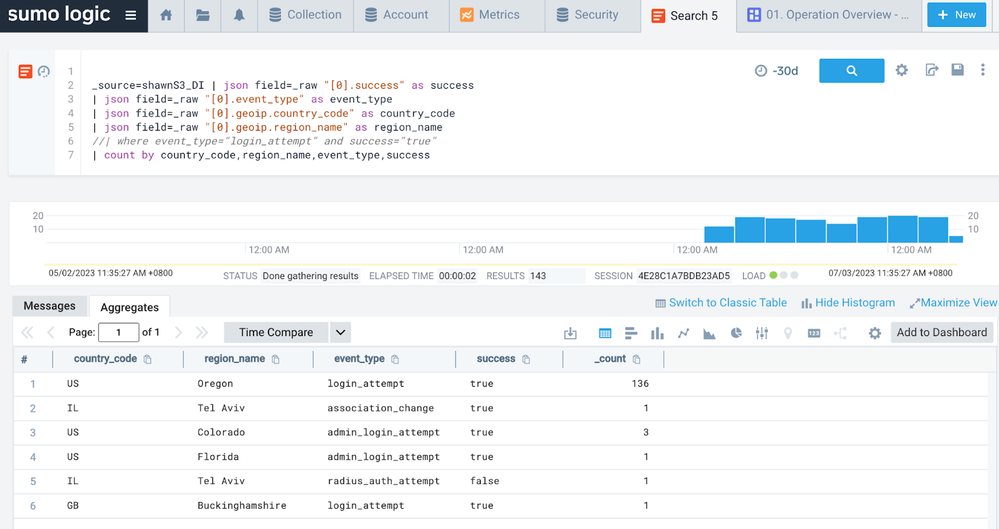
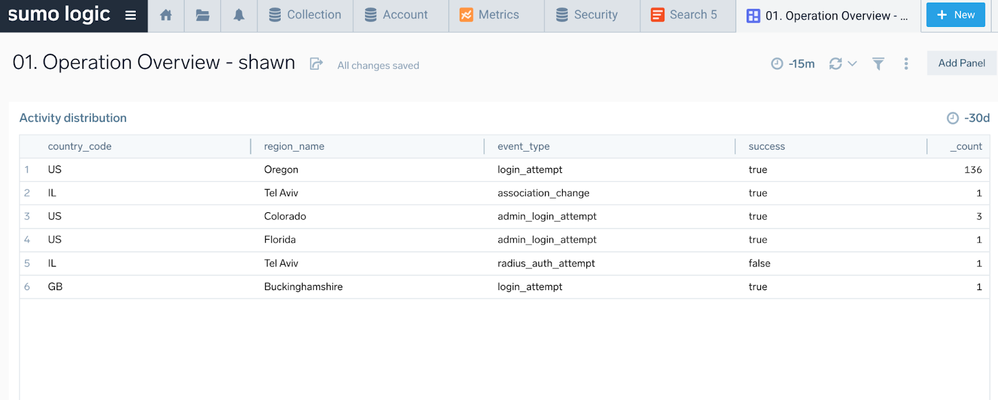
_source=<your_source_name> | json field=_raw "[0].success" as success | json field=_raw "[0].event_type" as event_type | json field=_raw "[0].geoip.country_code" as country_code | json field=_raw "[0].geoip.region_name" as region_name | count by country_code,region_name,event_type,success - And then you can create a dashboard for it:
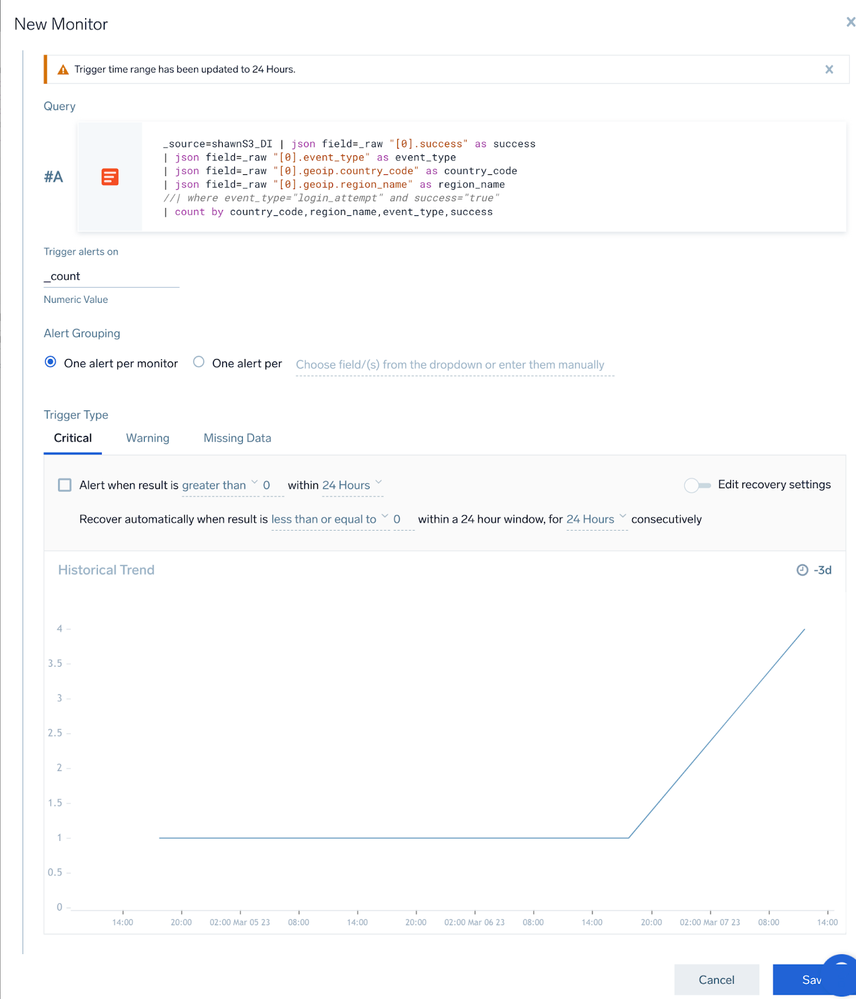
- Of course, you can create a monitor for alerting:
DataDog
Setup
Relatively straightforward thanks to the native integration.
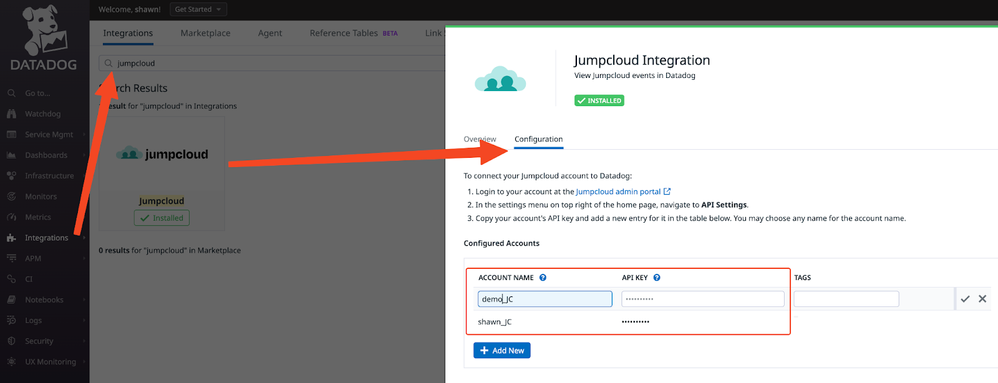
- Go to ‘Integrations” -> search Jumpcloud -> config -> input your API key (supports multiple tenants):
(Optional) You can also utilise the DI logs (JSON formatted) in S3 buckets to DataDog similarly to Sumo Logic, via a DD maintained AWS lambda function.
Use Cases
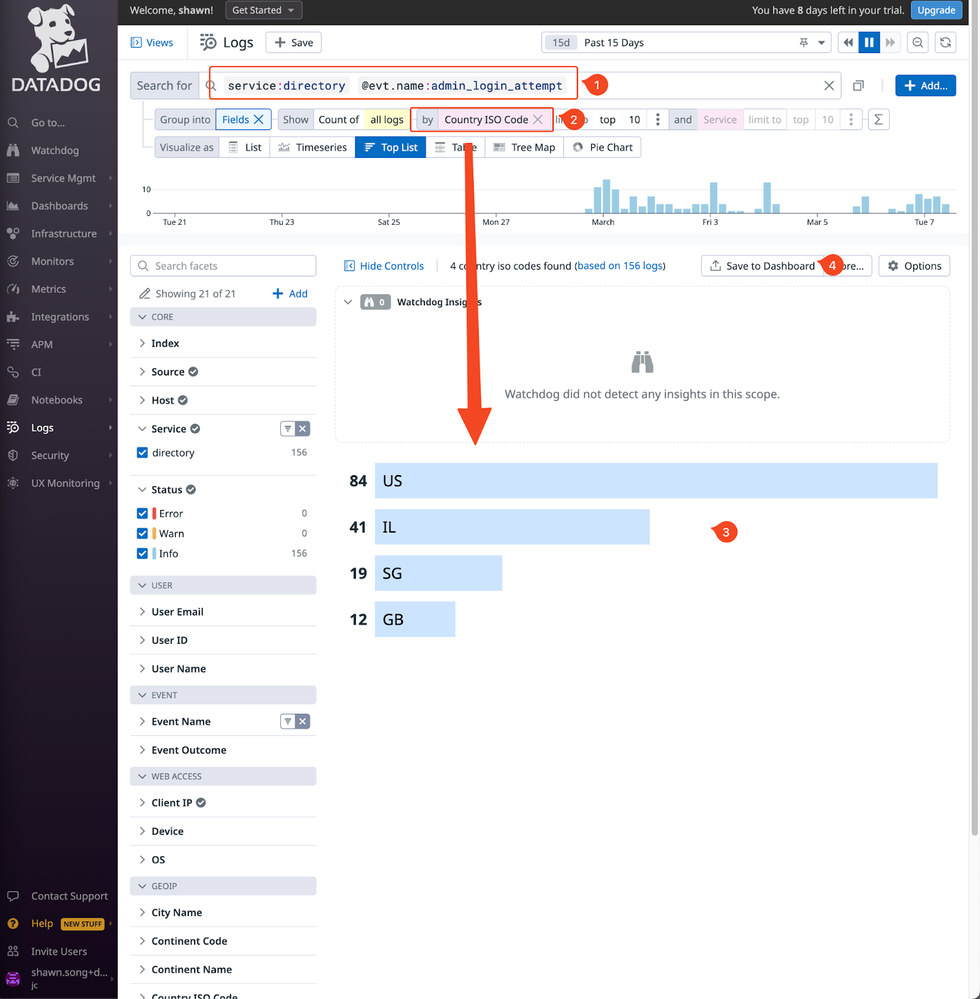
- Now you can do log search like this - for identifying the geo location for the admin logins, and save it to a dashboard:
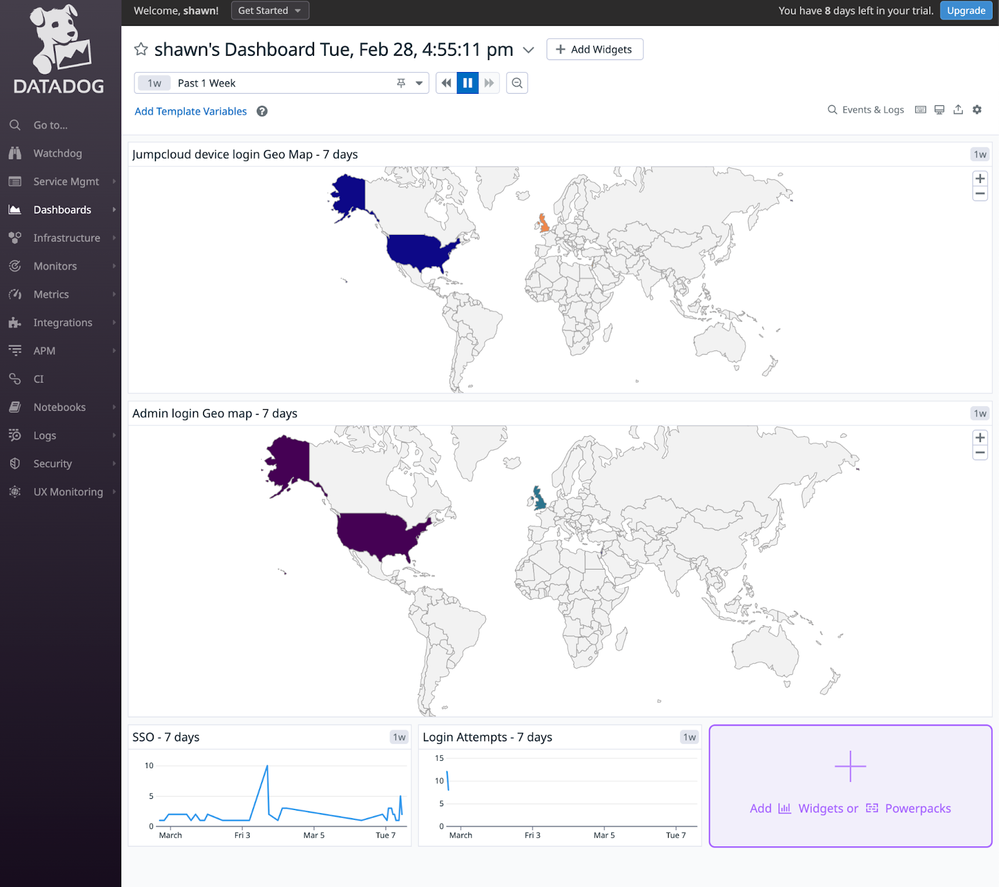
- Then you can use a geo map like this on the dashboard:
- And, of course create a monitor for alerting:
That's it!
Splunk
I found there are 2 JumpCloud Apps built by:
- Matthew Franklin - https://splunkbase.splunk.com/app/5412
- Maciej Duda - https://splunkbase.splunk.com/app/6613
However I couldn’t make either of those work within the permitted time I had on this topic. Given how sizeable Splunk means to the SIEM market, I will probably revisit it once I have more time.
Hope the above 2 cases help!
- Labels:
-
Compliance
